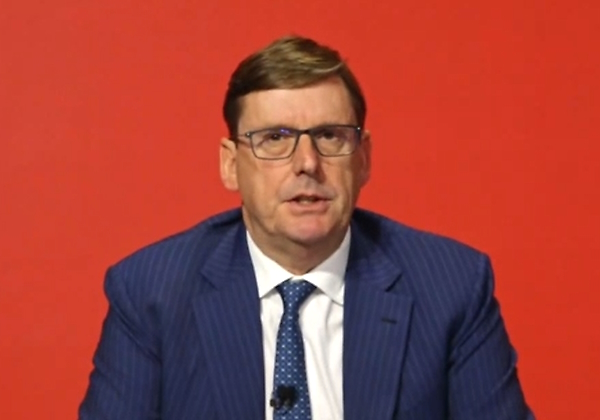
Westpac CFO Michael Rowland
Westpac reported a net profit of A$7.2 billion for the 12 months to September 2023 – an increase of 26 per cent over the previous corresponding period. But most of the gains were in the first half of the year.
Net profit of $3.2 billion in the September half was 20 per cent down on the first half result, due to higher expenses and impairment charges. Revenue was also down half-on-half, along with the net interest margin and return on equity.
Income: Net interest income rose 7 per cent to $18.3 billion, compared with the previous year. Non-interest income rose 36 per cent to $3.3 billion. Net operating income rose 10 per cent to $21.6 billion.
High-impact negotiation
masterclass
July 9 & 16, 2025
5:00pm - 8:30pm
This high-impact negotiation masterclass teaches practical strategies to help you succeed in challenging negotiations.
Expenses and cost to income: Operating expenses fell 1 per cent to $10.7 billion. The cost-to-income ratio fell from 55.1 per cent in 2021/22 to 49.4 per cent in the year to September. Excluding notable items, CTI fell to 47.5 per cent. CTI was lower in the first half, at 45.3 per cent (45.9 per cent excluding notable items).
Impairment expense: Impairments rose from $335 million in 2021/22 to $648 million in the year to September. The ratio of impairment charges to average loans rose from 5 basis points to 9 bps during the year. The bulk of this was new collectively assessed provisions. There were $197 million of individually assessed provisions, $127 million of write-backs and $191 million of recoveries.
Credit quality: Mortgage arrears (90 days or more past due) rose from 69 bps in 2021/22 to 81 bps in the year to September. Total stressed exposures as a proportion of total committed exposures rose from 1.07 per cent to 1.26 per cent.
Margin: The group net interest margin rose 2 bps to 1.95 per cent year-on-year. The bank also reported “core NIM”, excluding the impact of notable items, which rose from 1.75 per cent to 1.87 per cent. The main contributor to higher NIM was deposit spreads, while loan interest spreads were a negative. While NIM averaged 1.95 per cent over the year, it was 1.96 per cent in the first half and 1.94 per cent in the second.
Return on equity: ROE rose from 8.1 per cent to 10.1 per cent year-on-year.
Earnings per share: EPS rose from $1.52 in 2021/22 to $1.95 in the year to September.
Dividend: The bank declared a final dividend of 72 cents a share, taking the total dividend payout for the year to $1.42 a share. This is up 14 per cent from $1.25 in 2021/22. The dividend payout ratio was 69.2 per cent – down from 76.8 per cent the previous year.
The divisions: Westpac’s Australian consumer division made a profit of $3 billion – a fall of 7.3 per cent from the previous year. The change was largely the result of higher expenses and notable items. The Australian business banking division’s profit rose 77.3 per cent to $1.6 billion. Westpac Institutional Bank was up 54.4 per cent to $1.1 billion. Westpac New Zealand fell from a profit of $1.1 billion in 2021/22 to $887 million in the year to September.
Market share: The bank’s Australian home loan portfolio grew 4 per cent to $485.5 billion, which is more than 60 per cent of the bank’s total loans. The Australian home loan balance grew at 0.8 times system and market share fell from 22 per cent in 2021/22 to 21 per cent in the year to September. Personal credit card share was steady at 21 per cent and business lending share was steady at 15 per cent. Household deposit share rose from 20 to 21 per cent and business deposit share was steady at 18 per cent. In New Zealand consumer lending share was 18 per cent, business lending share 16 per cent and deposit share 18 per cent.
Capital: The common equity tier 1 capital ratio was 12.38 per cent – up from 11.29 per cent in 2021/22. The bank announced that it would launch a $1.5 billion share buyback, which will reduce CET1 by 30 bps.
Funding and liquidity: Customer deposits rose 5 per cent to $640.9 billion and the deposit-to-loan ratio rose 4 bps to 82.89 per cent. Deposits accounted for 66 per cent of total funding, short-term wholesale funding 8.1 per cent and long-term wholesale funding 18 per cent. The bank’s liquidity coverage ratio was 134 per cent and its net stable funding ratio was 115 per cent.
Customer remediation: The bank paid $194.8 million to 867,000 customers during the year. It closed five remediation programs and opened one new program. The net profit impact was $72 million, up from $60 million in 2021/22. The net profit impact of provisions for customers refunds and associated costs since 2017 has been $2.06 billion.
Staffing and branches: The number of full-time equivalent employees fell 4 per cent to 36,146. Australian branch numbers were cut 12 per cent to 644 over the year. New Zealand branch numbers were steady, falling from 115 to 112 over the year.